
Properties falling behind
In the Properties table, the Δ % column shows which property is losing against the comparison period and which is gaining.
HAYP's analytics are for revenue and operations leads who run several properties. They calculate the key figures from your Apaleo reservations for the whole portfolio and for each property, using the same definitions. You see which property carries the portfolio and which one needs attention, without stitching exports together.
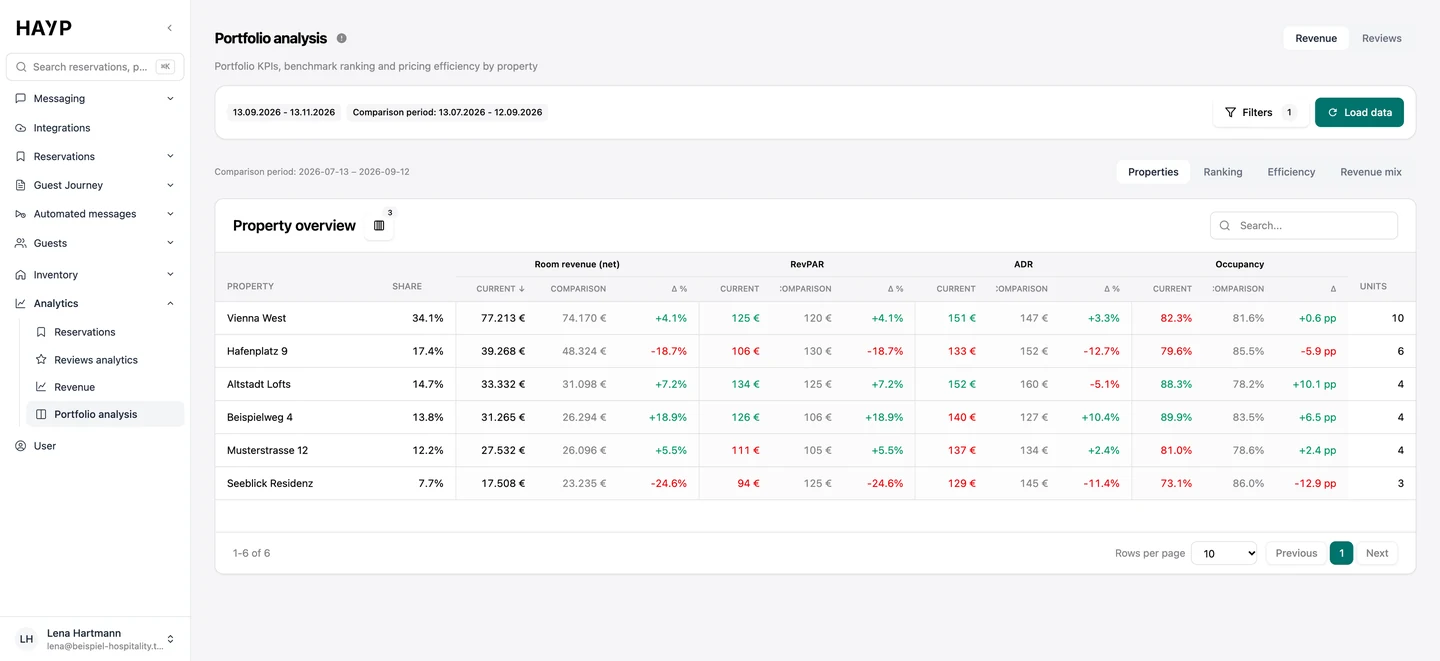
All values refer to the selected period. Revenue and nights are counted by stay, not by booking date. By default, confirmed reservations, in-house guests and departed guests are included.
| KPI | How HAYP calculates it |
|---|---|
| Room revenue (net) | Net room revenue for the nights stayed in the period |
| Commission | Commission on the reservations in the period |
| Available room nights | Units × days, minus blocked nights (out of order, out of inventory) |
| Occupancy | Sold ÷ available room nights |
| ADR | Room revenue ÷ sold room nights |
| RevPAR | Room revenue ÷ available room nights |
| Avg. length of stay | Nights ÷ bookings |
| Avg. lead time | Days between booking and arrival |
| Cancellation rate | Canceled ÷ all reservations arriving in the period |
The Revenue page shows the KPIs at the top, then occupancy with sold and available room nights, and room revenue over time by day, week, month, quarter or year. Two breakdowns show revenue by channel and by source, a third shows commission by source. That tells you what a channel brings in and what it costs. How the platforms calculate their commission is explained in the guide to Booking.com commission and Airbnb fees.
The Analysis tab lists each period as a row: sold and available nights, bookings, length of stay, ADR net, average rate gross and commission.
You can filter by period, property, unit group, unit, channel, source and reservation status. How RevPAR and ADR relate is explained in the guide to the RevPAR formula.
Room revenue, commission, RevPAR and ADR, occupancy and revenue by channel and source for the chosen period.
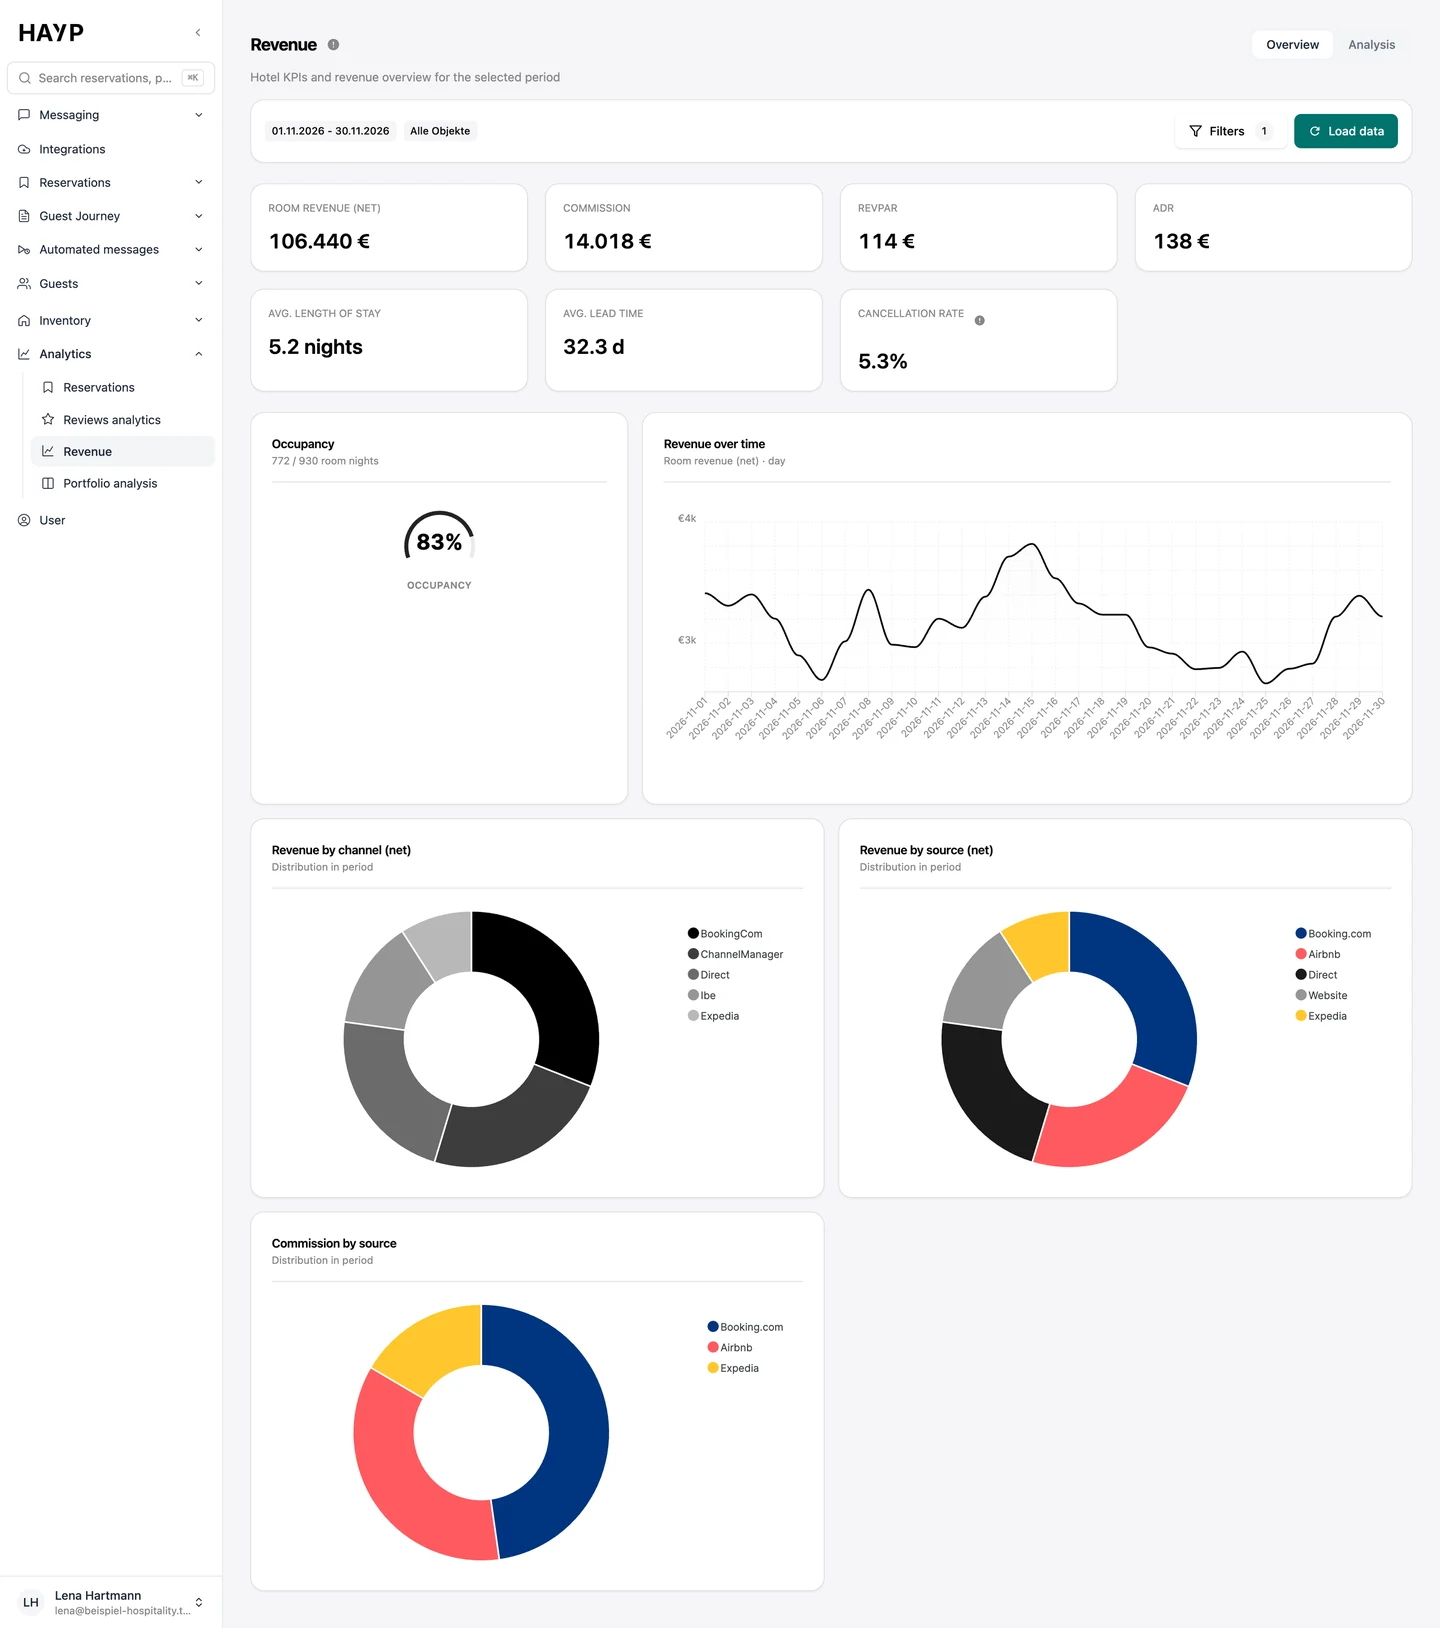
The same figures per day, week, month, quarter or year, here 13 calendar weeks.
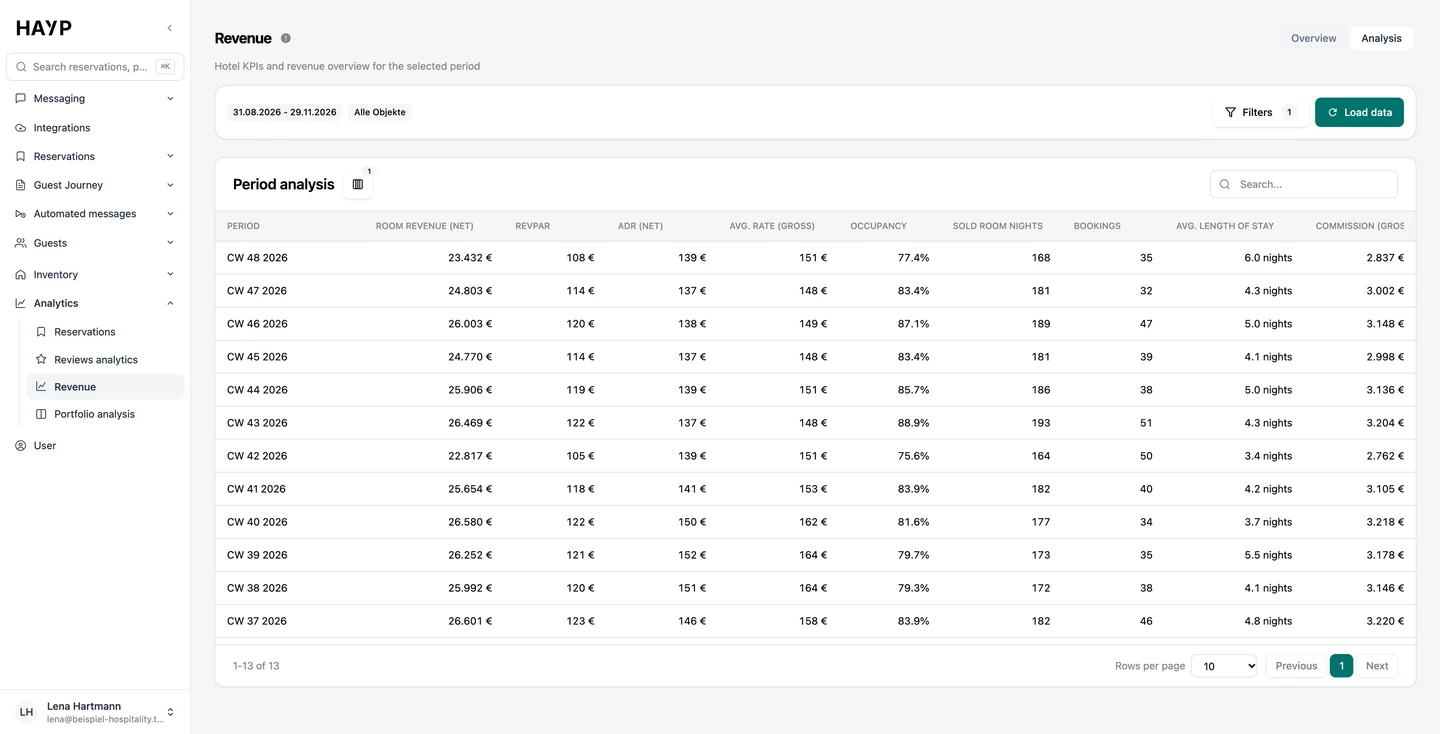
The Properties tab puts every property in one table: share of portfolio revenue and number of units, plus room revenue, RevPAR, ADR, occupancy and sold nights, each for the current and the comparison period with the change. You choose the comparison period yourself.
Three more tabs each give a different angle:
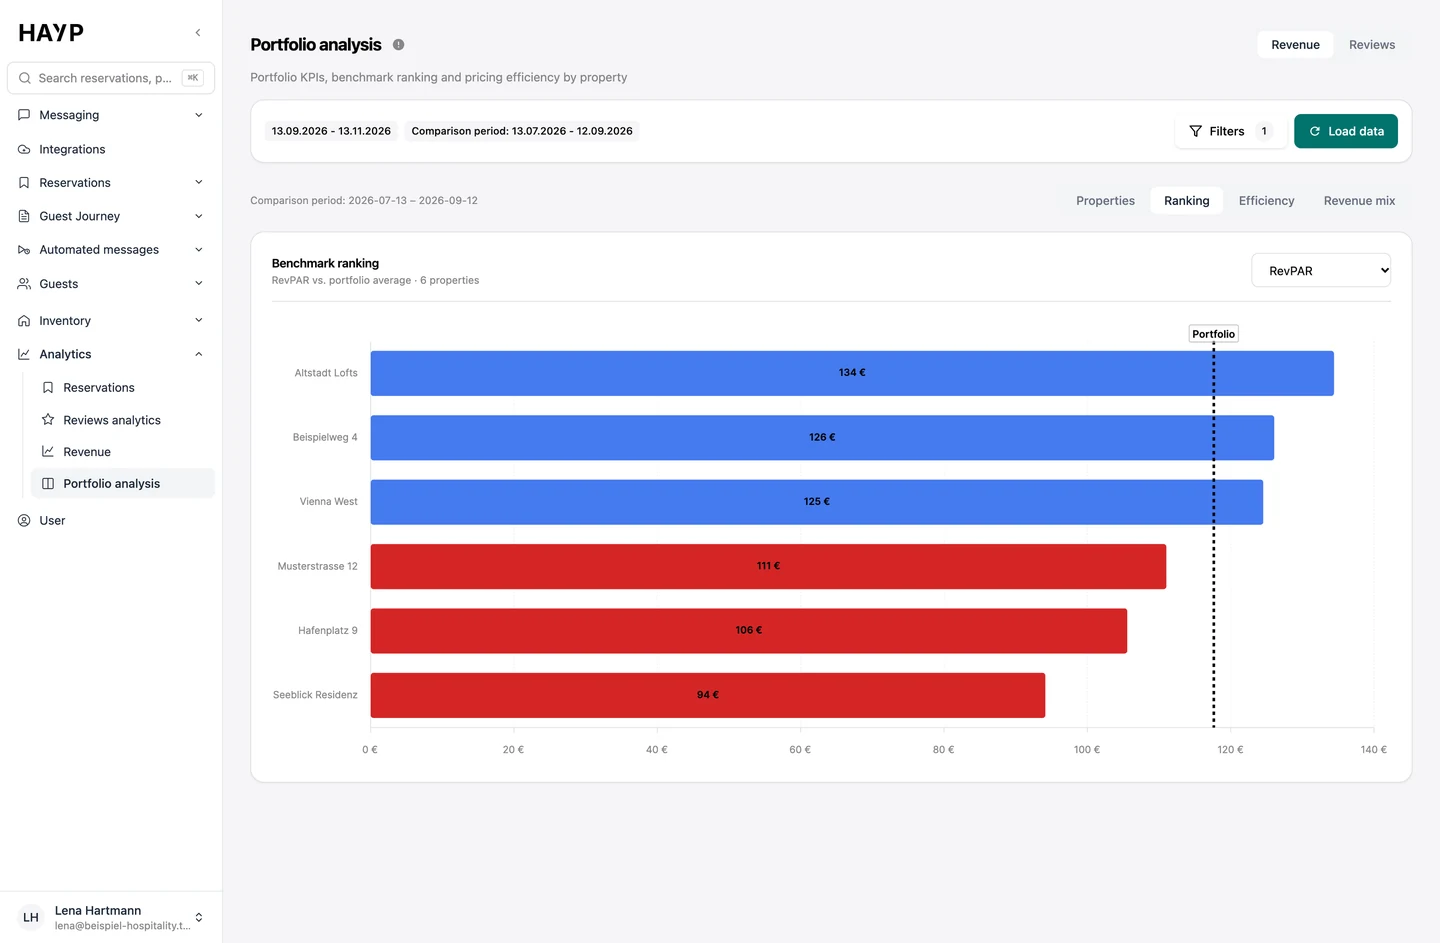
RevPAR per property against the portfolio average.
ADR against occupancy: which property earns through price and which through occupancy.
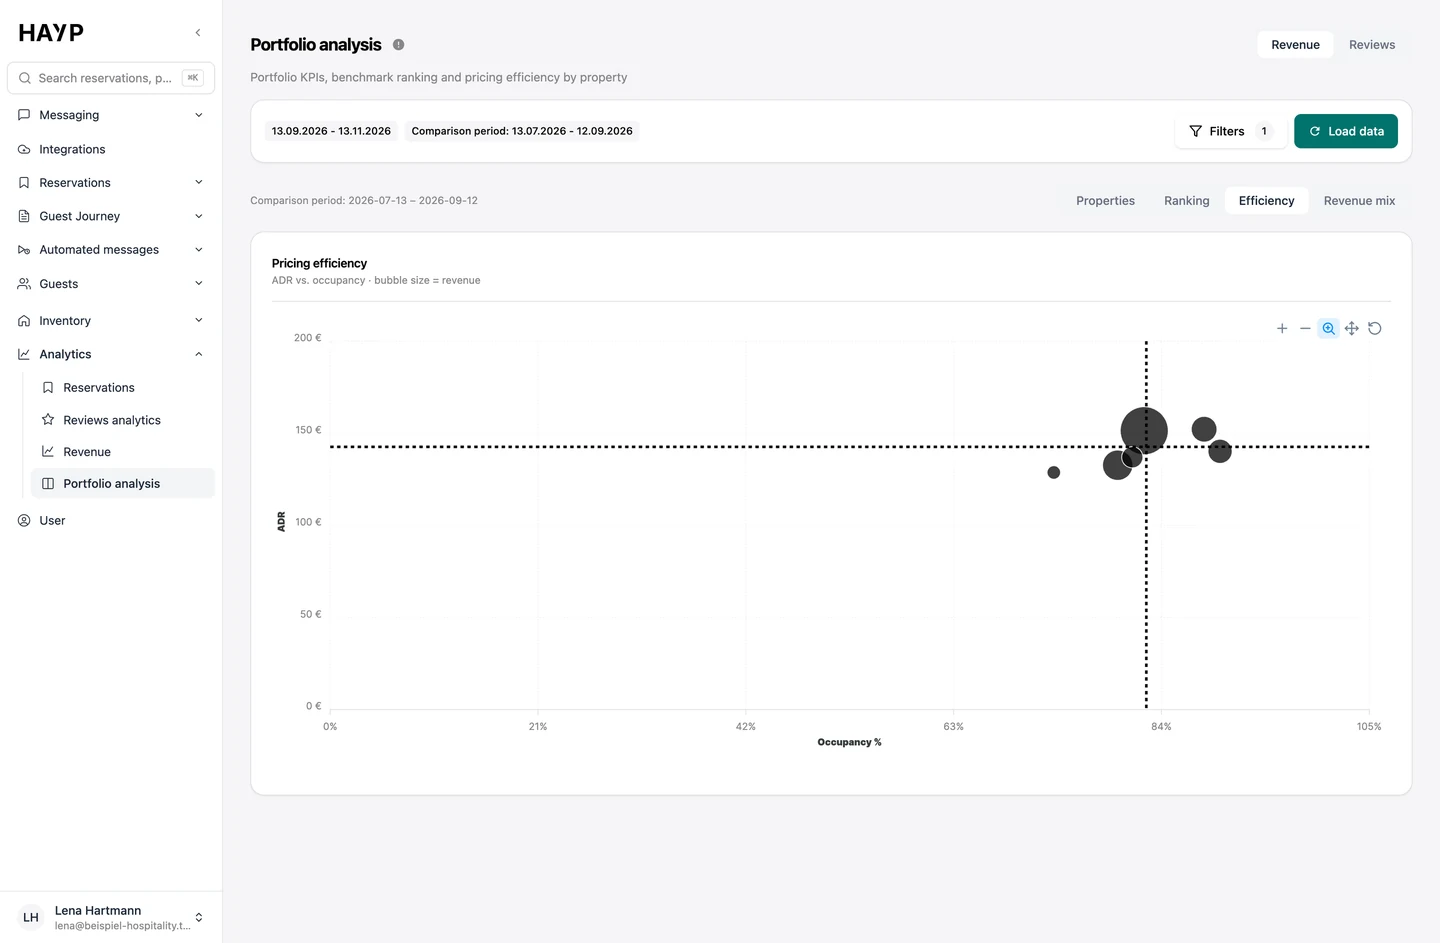
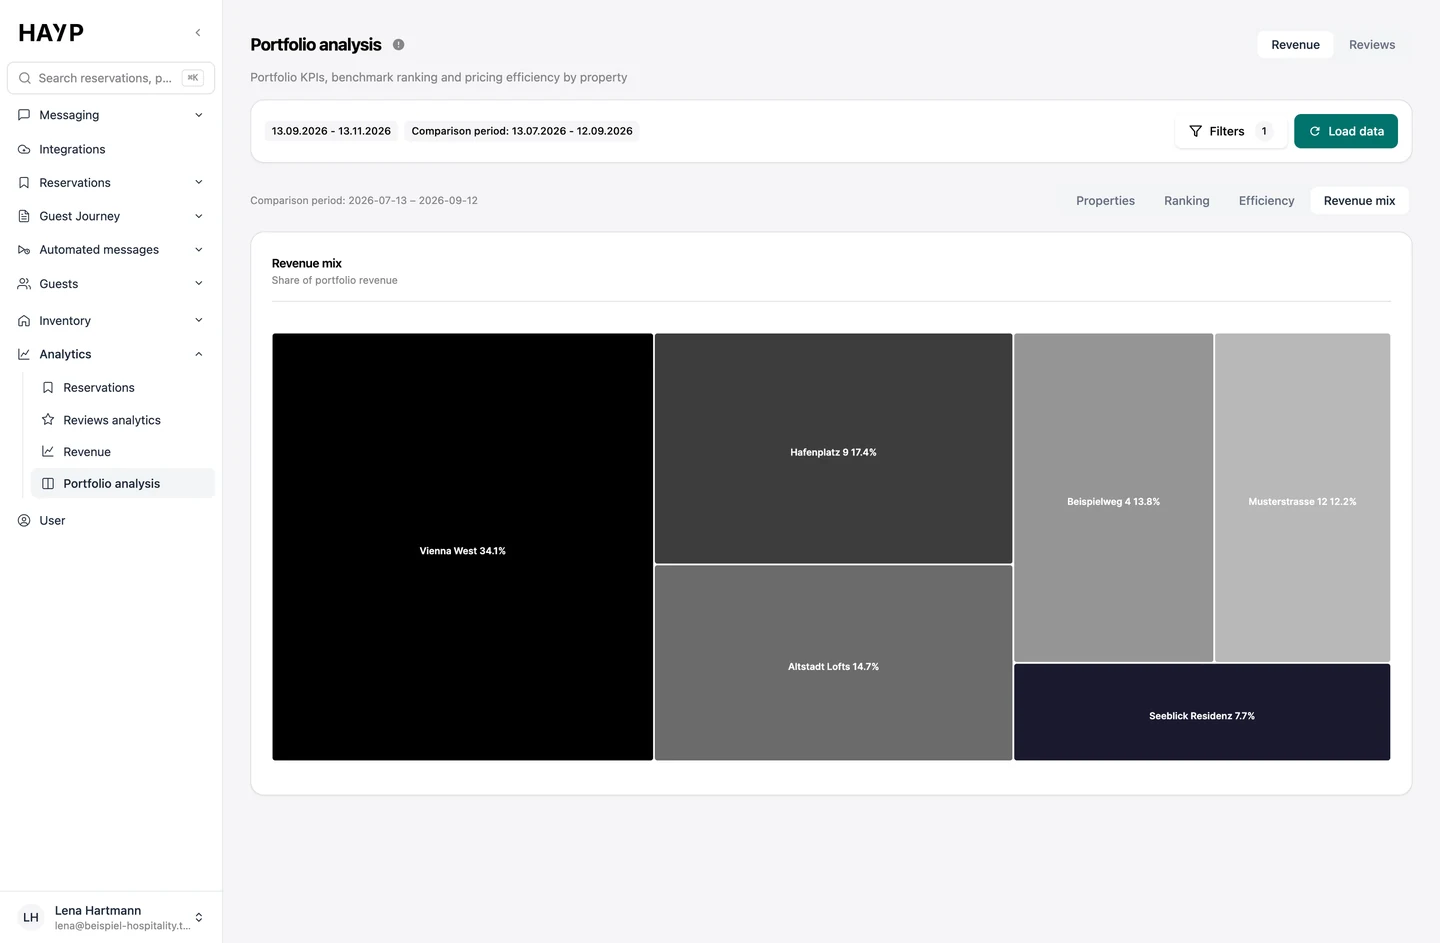
The share each property has in the portfolio's revenue.
Typical questions from the weekly routine, and the view that holds the answer.
In the Properties table, the Δ % column shows which property is losing against the comparison period and which is gaining.
Revenue by channel and commission by source sit next to each other, so you see which channel brings revenue and how much commission it costs.
The Efficiency tab shows at a glance which properties combine high occupancy with a low ADR. That is where rates deserve a look.
Lead time and length of stay show how early and how long guests book; the cancellation rate shows how many bookings fall away again. Filter by channel to compare the platforms.
Under Reservations you see booking volume over time, bookings by channel and source, and the breakdown by status.
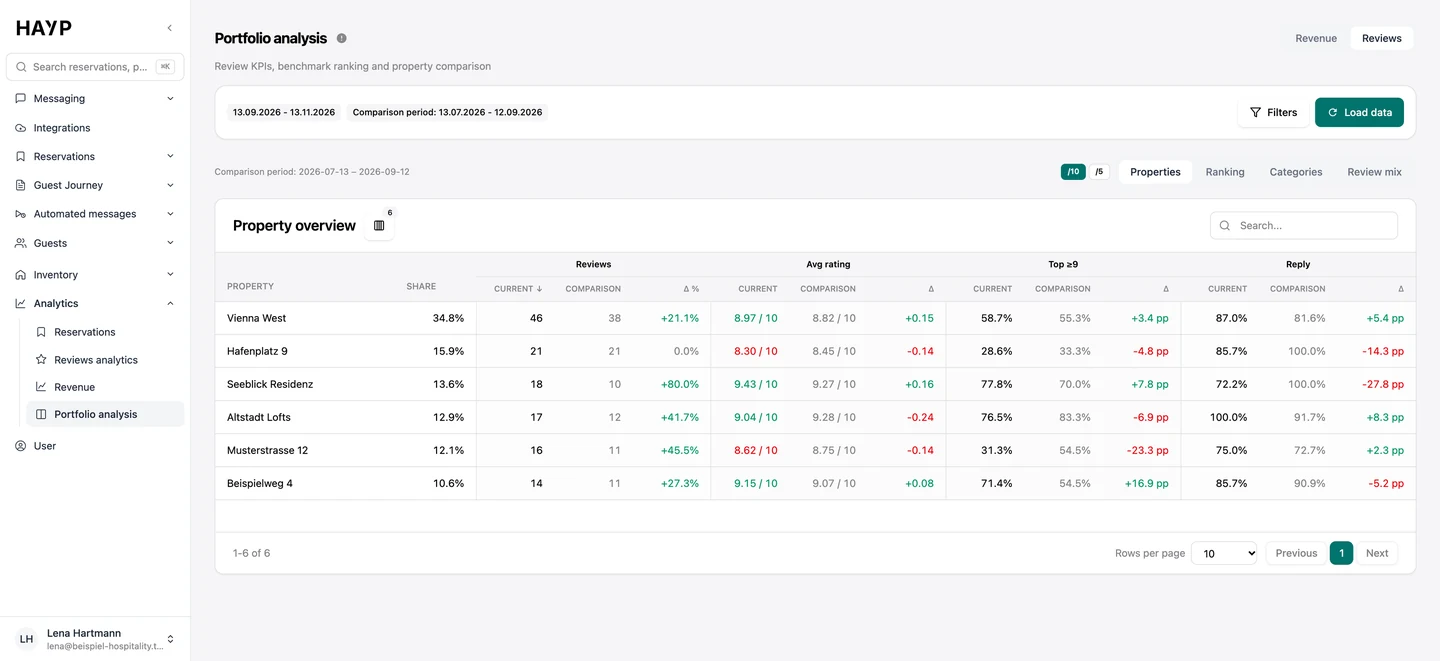
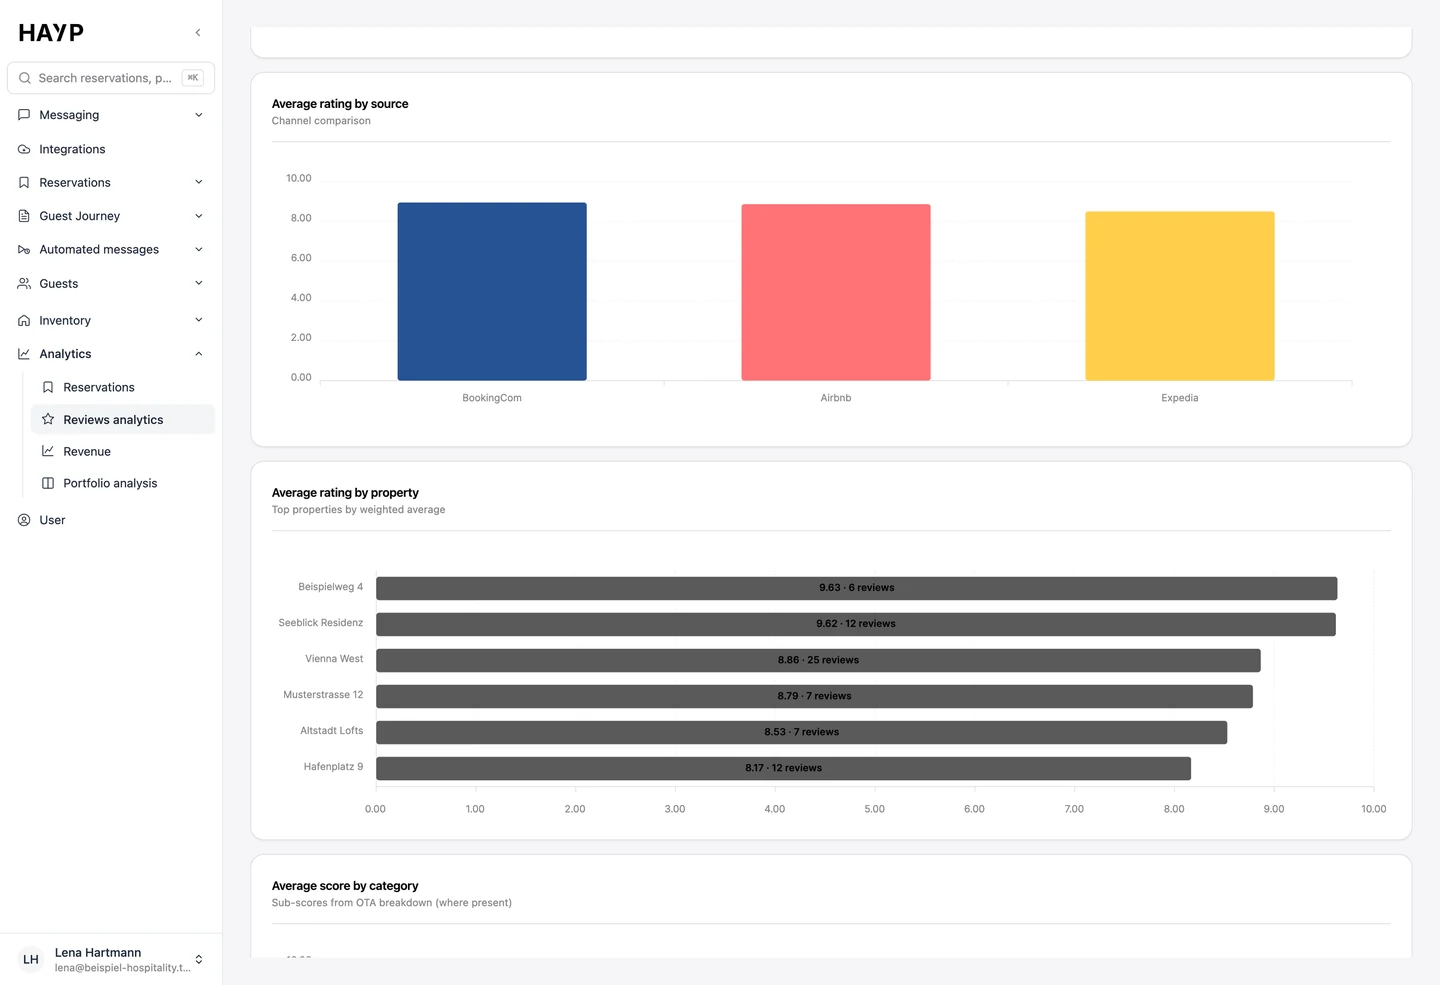
Portfolio analysis also has a Reviews mode next to Revenue: a property table with comparison period, a ranking by average rating, category scores and review mix. What lies behind the ratings is covered by review management, with its AI analysis by topic.
Number of reviews, average rating, share of very good reviews and response rate per property.
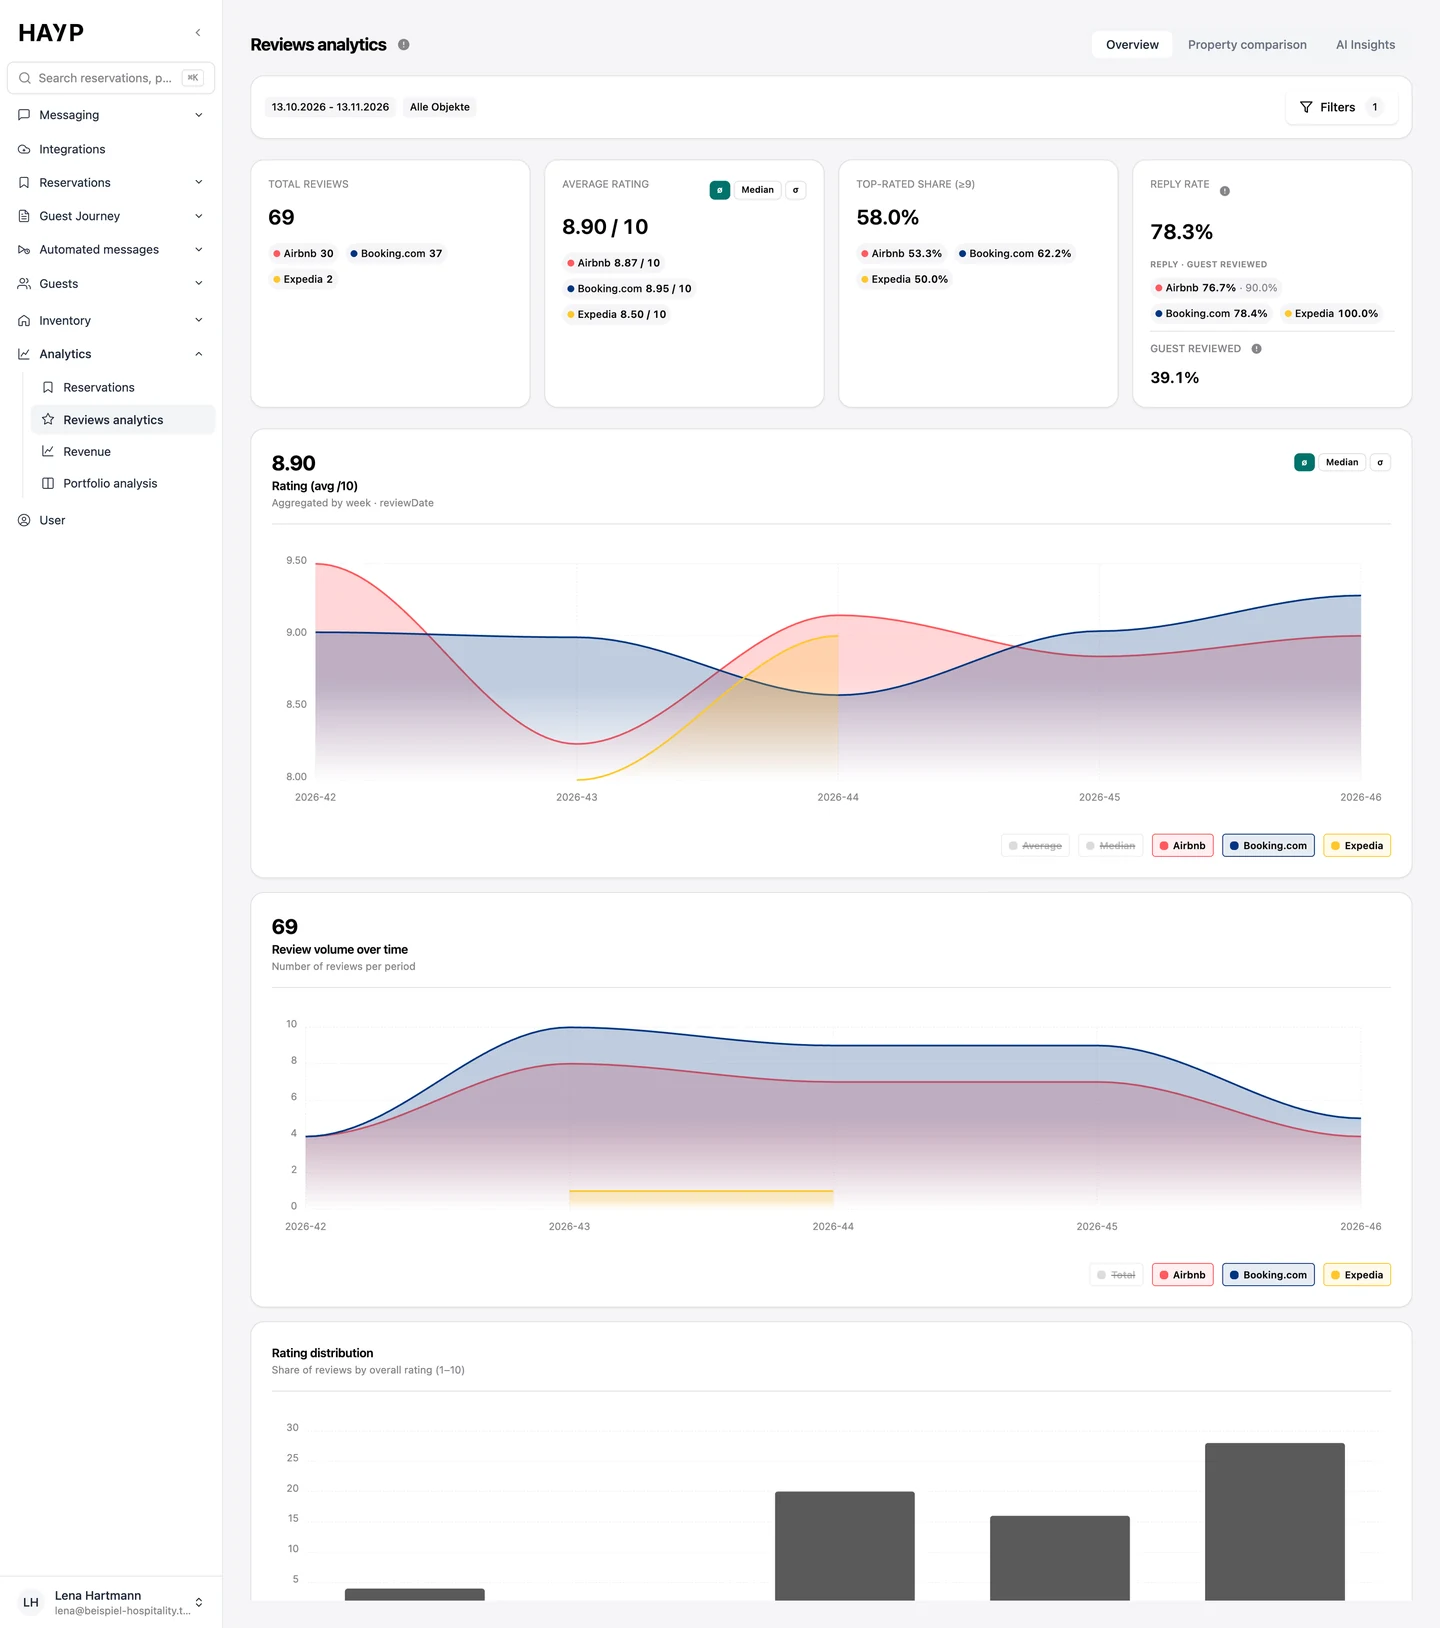
Reviews and average rating over time, split by platform.
Average rating per platform and per property side by side.
RevPAR formula with a worked example: how it differs from ADR and occupancy, TRevPAR and GOPPAR, common mistakes and how to compare properties of any size.
Learn moreThe ADR formula with a worked example: what counts as room revenue, ADR by channel and across properties, common mistakes and how ADR relates to RevPAR.
Learn moreBooking.com commission and Airbnb host fees: what the rates depend on, what they are charged on, what Genius and Preferred cost, with a worked example.
Learn moreHotel review management with HAYP: reviews from all properties in one list, AI reply suggestions in your tone and language, and analysis by topic.
Learn moreFAQ
RevPAR is room revenue divided by available room nights or, equivalently, ADR multiplied by occupancy. A property with an ADR of €100 and 70% occupancy has a RevPAR of €70. The guide to the RevPAR formula walks through it with examples.
ADR divides room revenue by the room nights sold and shows the average price. RevPAR divides the same revenue by all available nights, so empty rooms pull it down. Only the two together show whether a property earns through price or through occupancy. The guide to the ADR formula has the calculation and a worked example.
For comparing properties, occupancy, ADR and RevPAR are regarded as the three most important metrics. HAYP shows them per property and adds room revenue, commission, length of stay, lead time and cancellation rate.
In portfolio analysis. The Properties tab shows each KPI per property for the current and the comparison period, and the ranking shows the gap to the portfolio average. Because every property is calculated with the same definitions, the values are comparable.
From the reservations in your PMS. HAYP is integrated directly with Apaleo and reads reservations, properties, unit groups and units. The cancellation rate is counted the same way as in Apaleo's General Manager report. HAYP's analytics engine currently holds more than 100,000 reservations.
€2 net per unit per month, €1.50 from the 201st unit, for revenue analytics, portfolio analysis and review analytics. Analytics needs no setup and has no minimum term, and the scope can change for the following month. See pricing for details.
For a one-off analysis from an export, often yes. Run continuously, a home-built version has to keep PMS reservations up to date, count cancellations and commission consistently and be adjusted whenever the data structure changes. HAYP's analytics calculate every property by the same definitions from your Apaleo data. When building pays off is covered under build or buy.
We show revenue analysis and portfolio analysis and work out how your Apaleo data is connected.